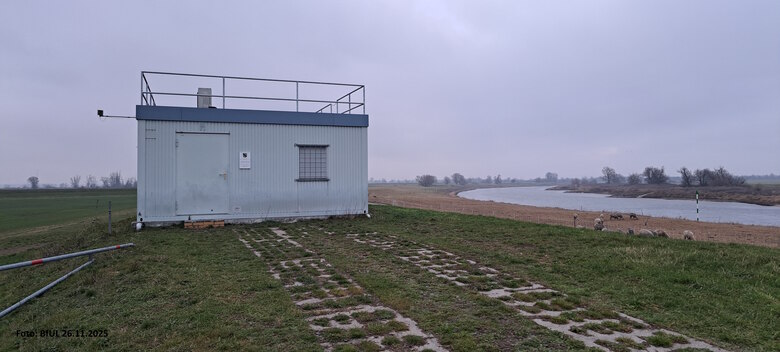
Messstation Dommitzsch, Elbe links, (Fluss-km: 557; alte Kilometrierung 173)
Die Gewässergütemessstation befindet sich flussabwärts von Dommitzsch am linken Ufer der Elbe.
Datum der letzten Datenvalidierung:
11.02.2026 15:00 Uhr
Alle Zeitangaben beziehen sich auf die Mitteleuropäische Zeit (MEZ).
Hinweise:
31.01. bis 02.02.2026 Störung bei Ammoniumstickstoffmessung
- Messwerttabelle Dommitzsch (*.xls, 0,9 MB) nur validierte Werte
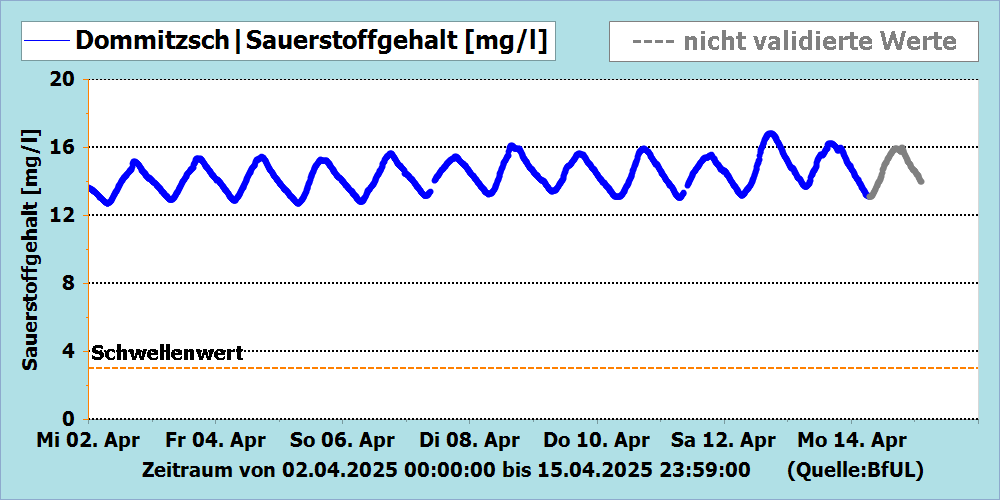
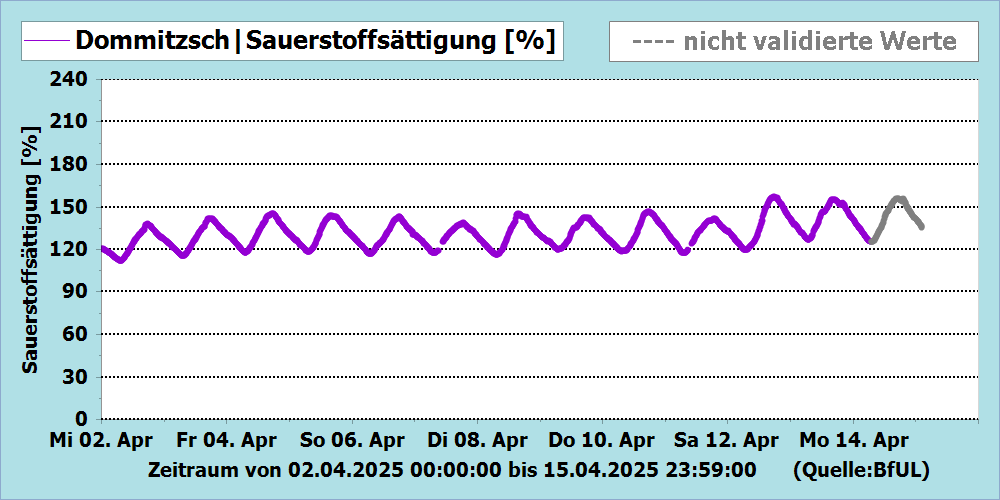
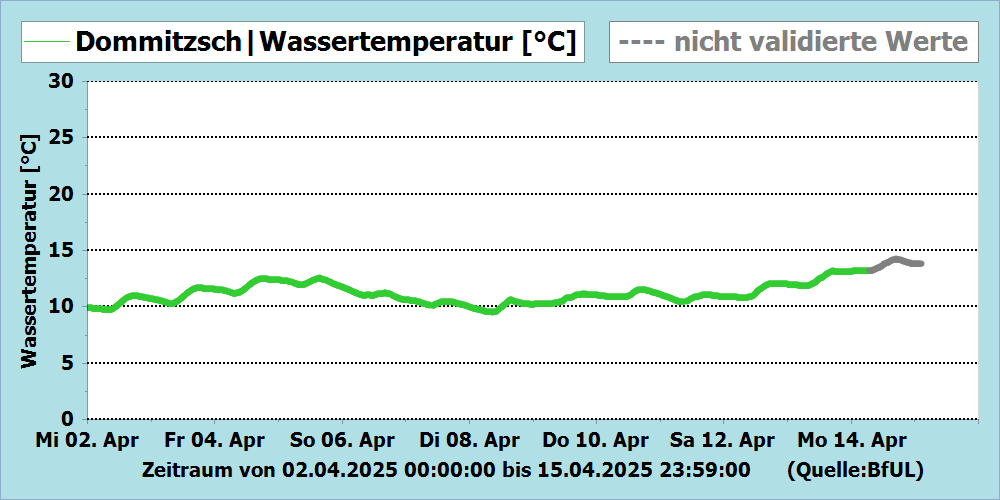
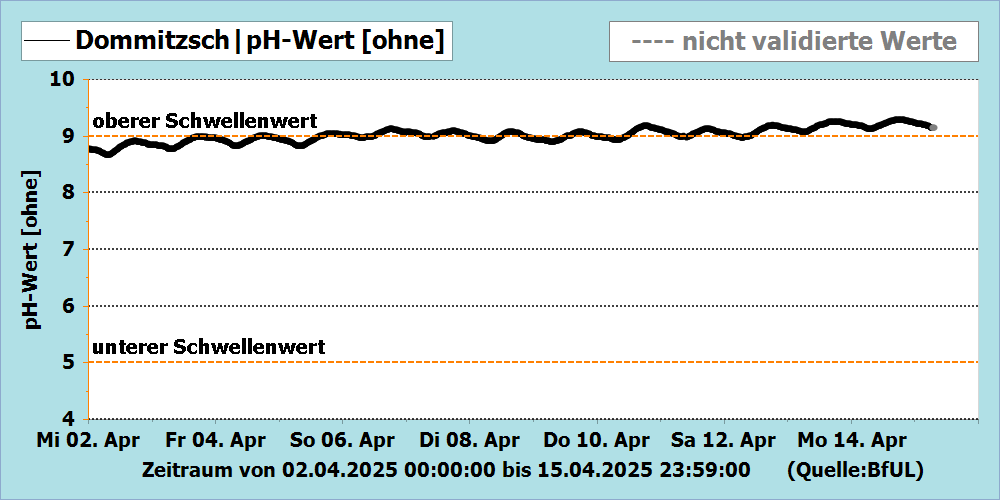
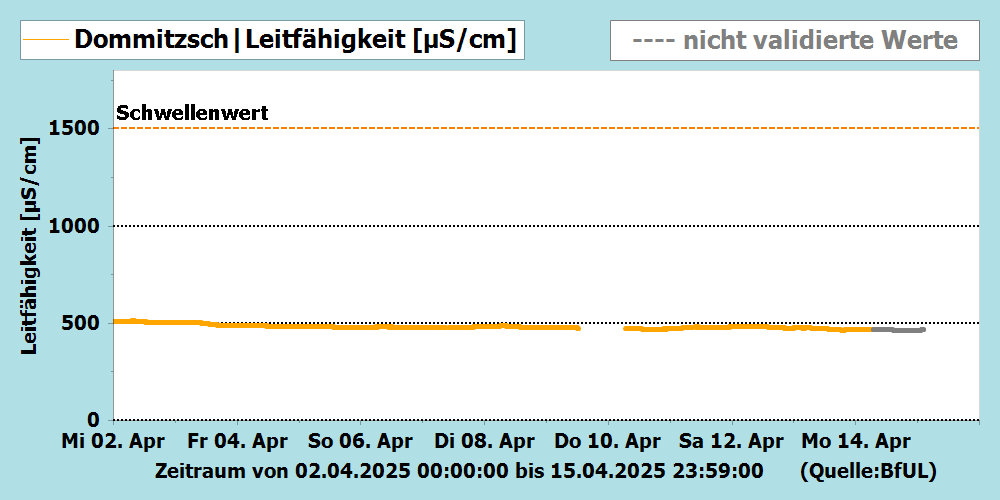
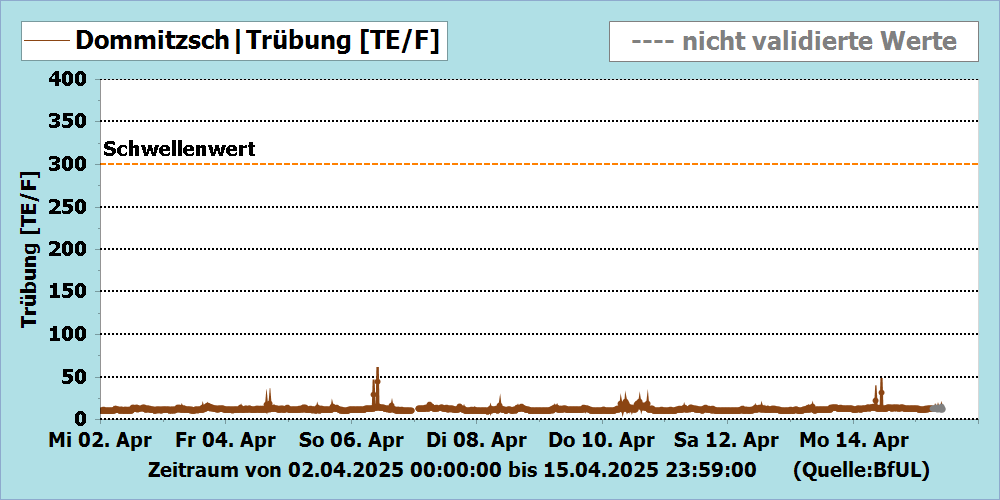
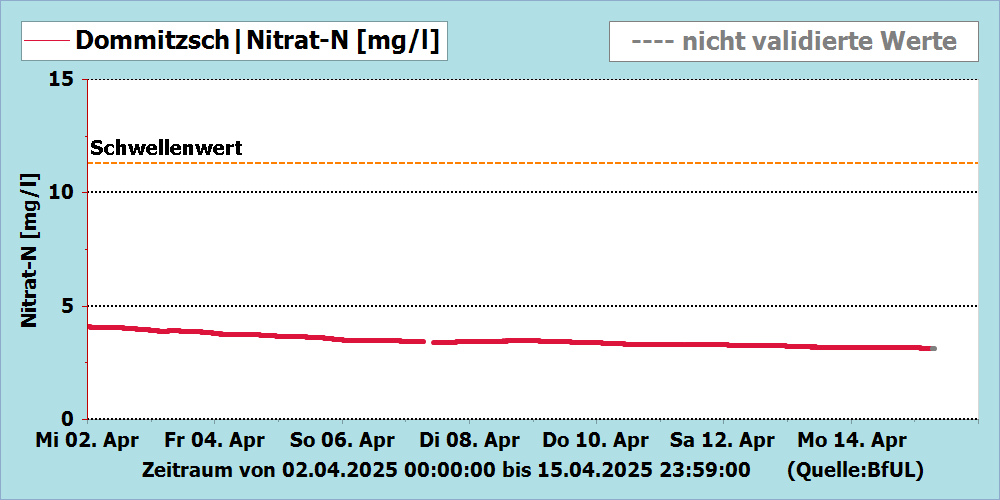
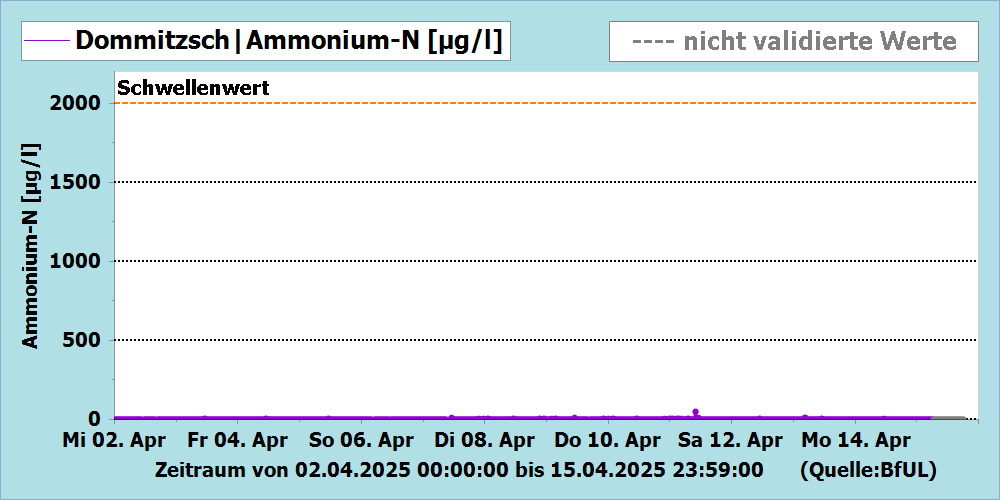
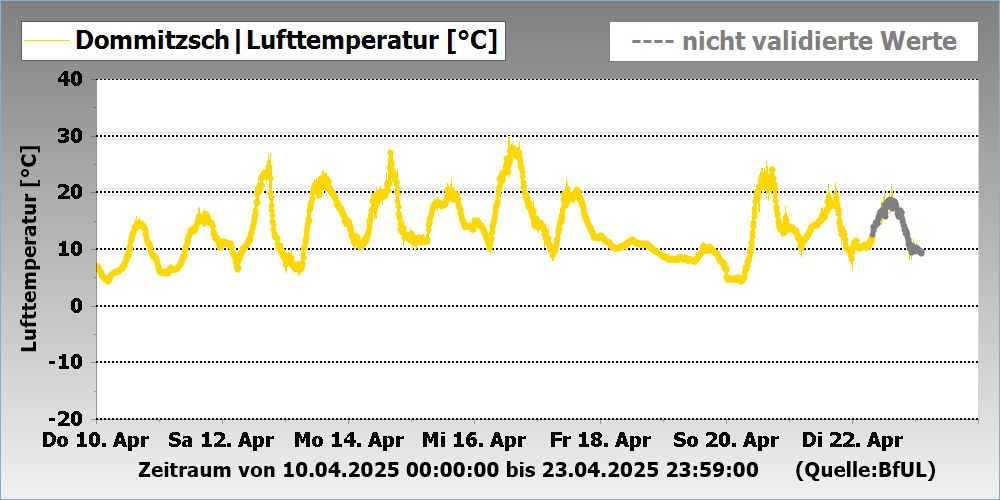
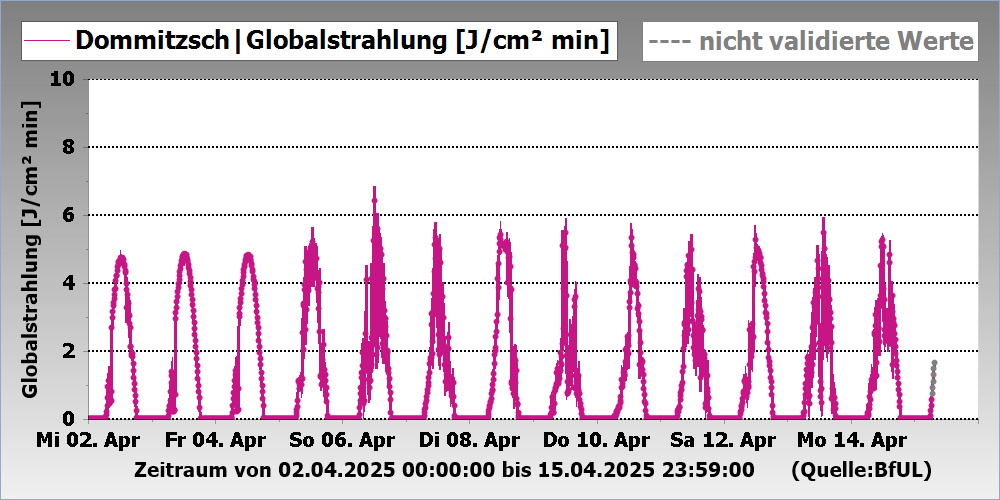
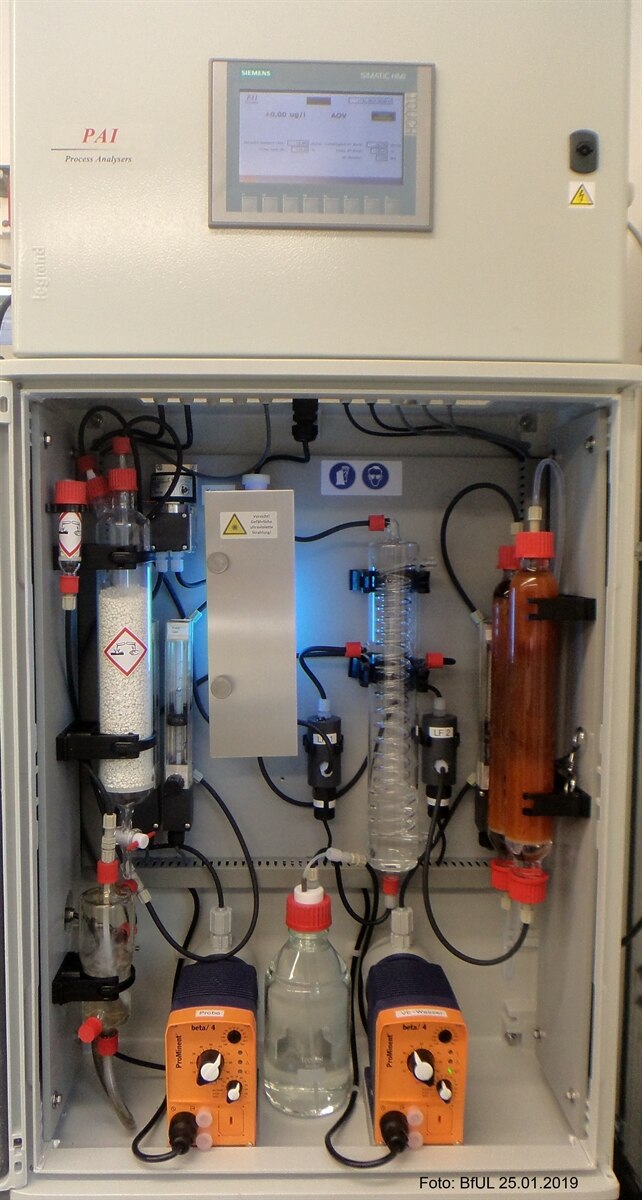
Ausblasbare organische Verbindungen (AOV-Monitor):
![]()
keine Auffälligkeiten seit den letzten 14 Tagen
Betriebszeit: seit 1996 durchgehend
Ausstattung:
|
Meteorologische Parameter |
Lufttemperatur |
|
Physikalisch-chemische Parameter |
pH |
|
Probennahme |
3 automatische Probennehmer für Wochenmischproben / Ereignisproben |
|
Betriebsinterne Steuergrößen |
Druckmessung Probenwasser |
|
Datenerfassung |
DFÜ in eine zentrale Datenbank |
Hinweise:
18. bis 23.02.2025 Gerätestörung bei Ammoniumstickstoffmessung
24. bis 27.02.2025 Gerätedefekt bei Leitfähigkeitsmessung
11. bis 17.03.2025, 06. bis 08.05.2025 und 13. bis 19.05.2025 Gerätestörung bei Trübungsmessung
20. bis 30.04.2025 Störung bei Nitratstickstoffmessung
19./20.05.2025 Störung bei pH-Wert und Wassertemperatur
14. bis 18.06.2025 unplausible Trübungsmesswerte
30.06. bis 28.07.2025 Abschaltung der Messstation auf Grund der Niedrigwassersituation in der Elbe
08. bis 11.08.2025 Gerätestörung bei Ammoniumstickstoffmessung
11.08. bis 15.09.2025 Abschaltung der Messstation auf Grund der Niedrigwassersituation in der Elbe
31.01. bis 02.02.2026 Störung bei Ammoniumstickstoffmessung
Bearbeitungsstand 05.02.2026
Messwertabelle Dommitzsch der letzten 365 Tage
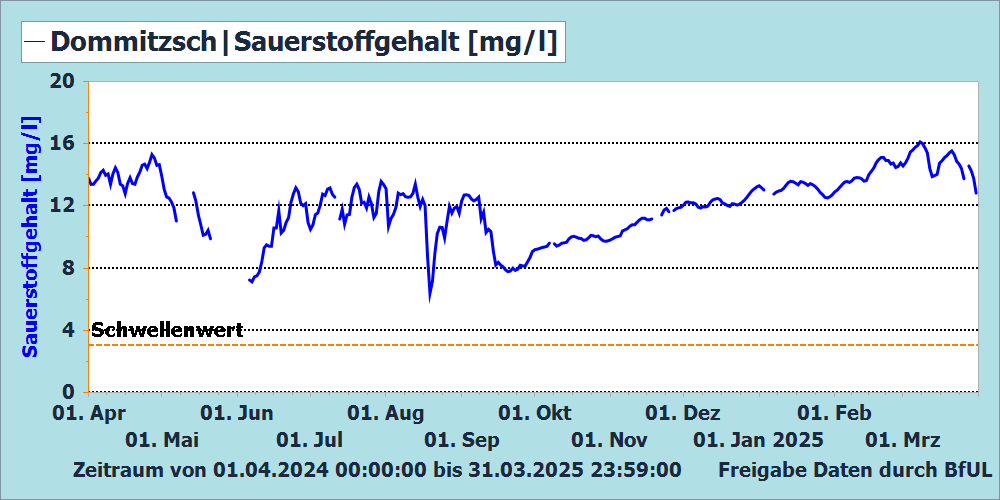
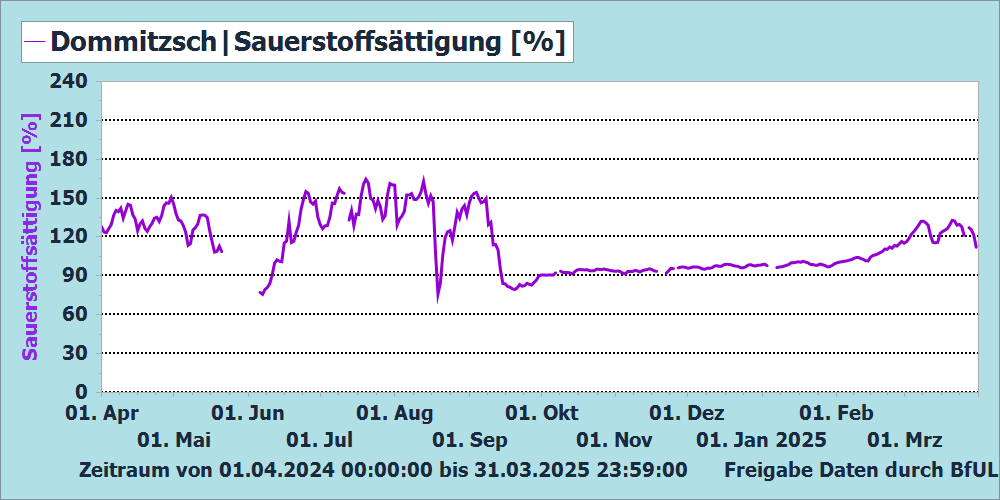
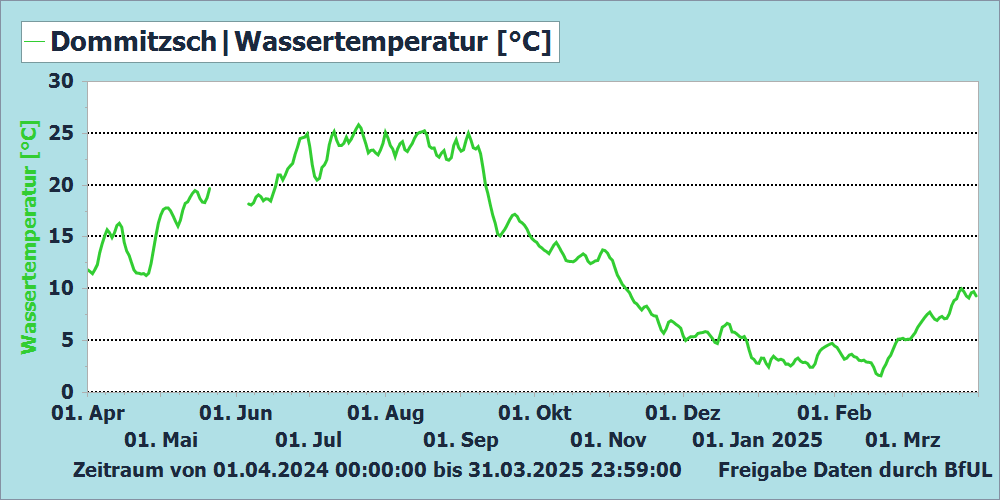
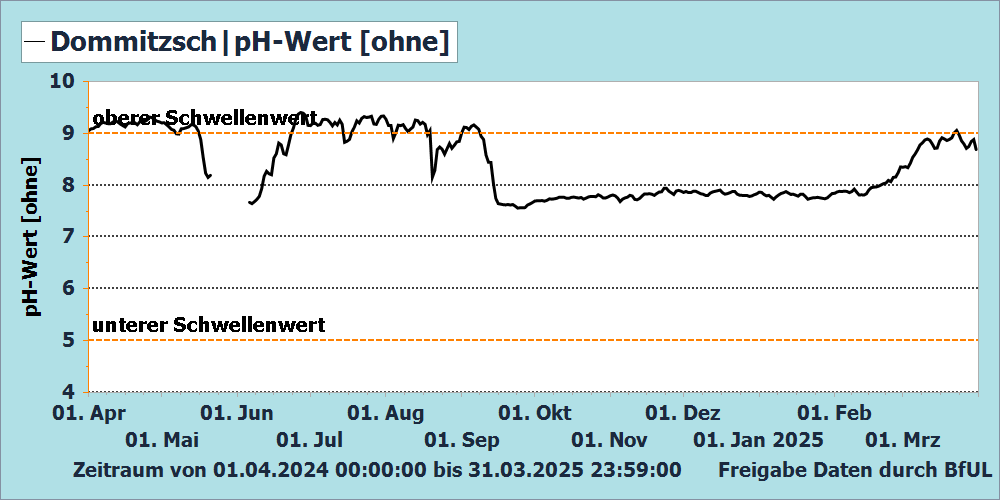
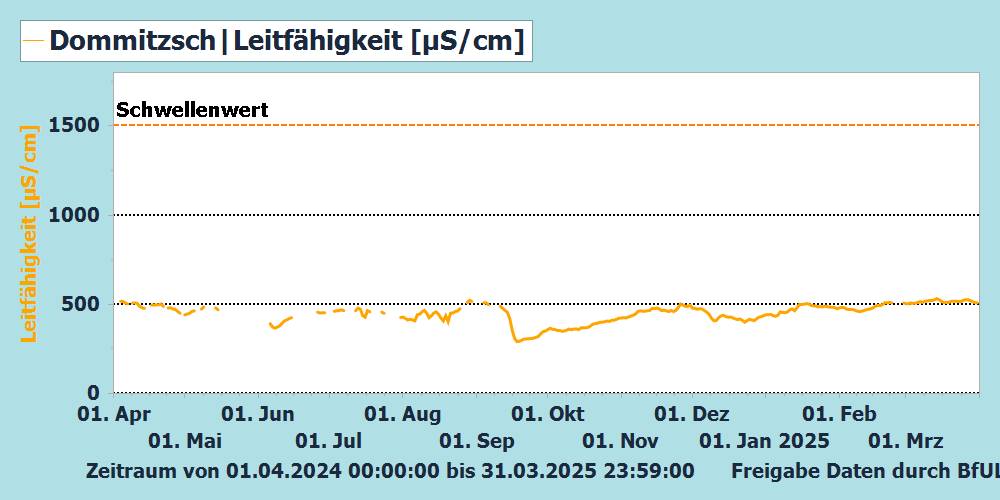
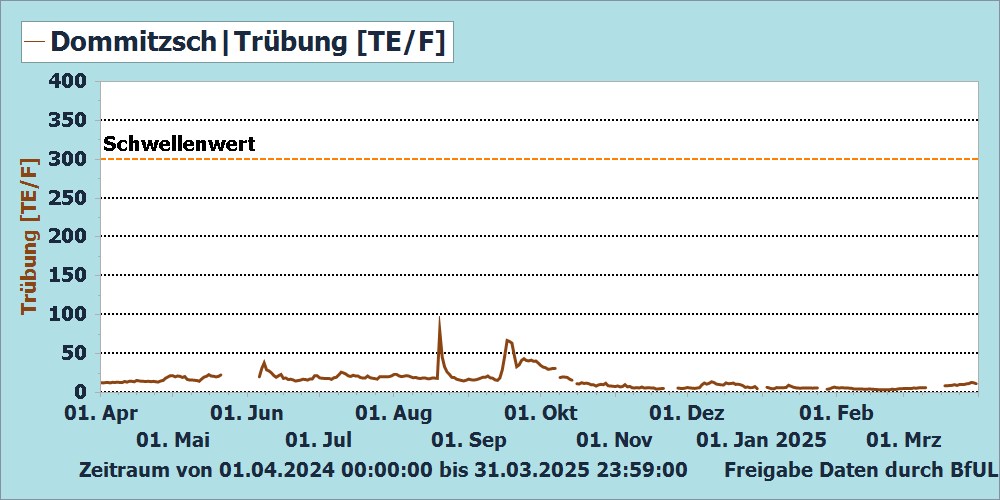
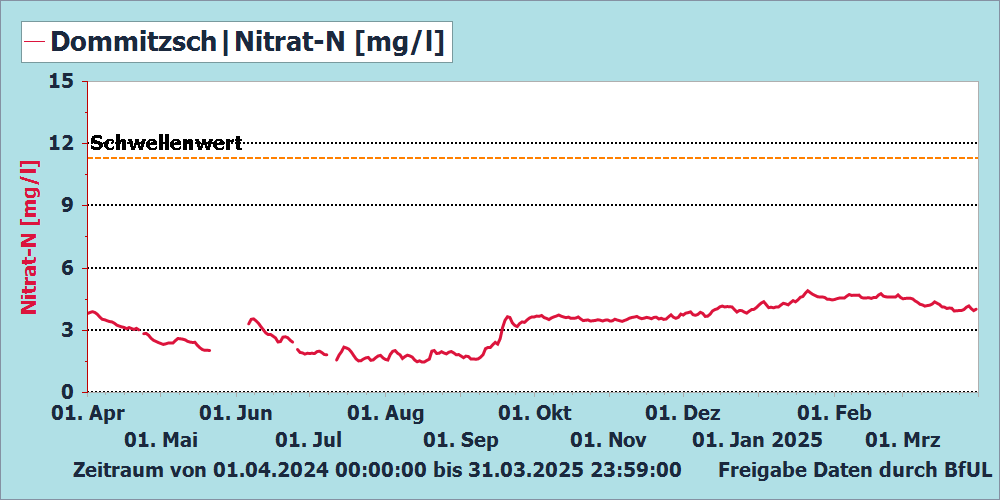
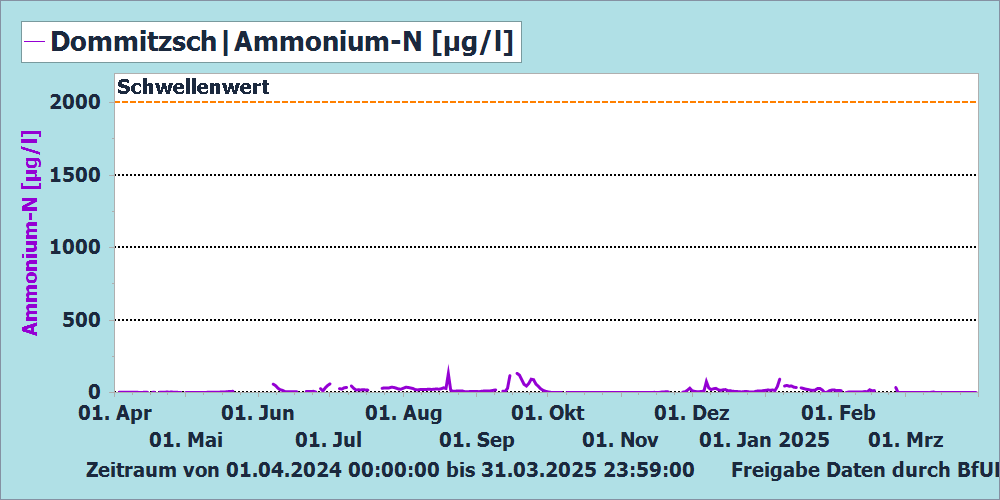
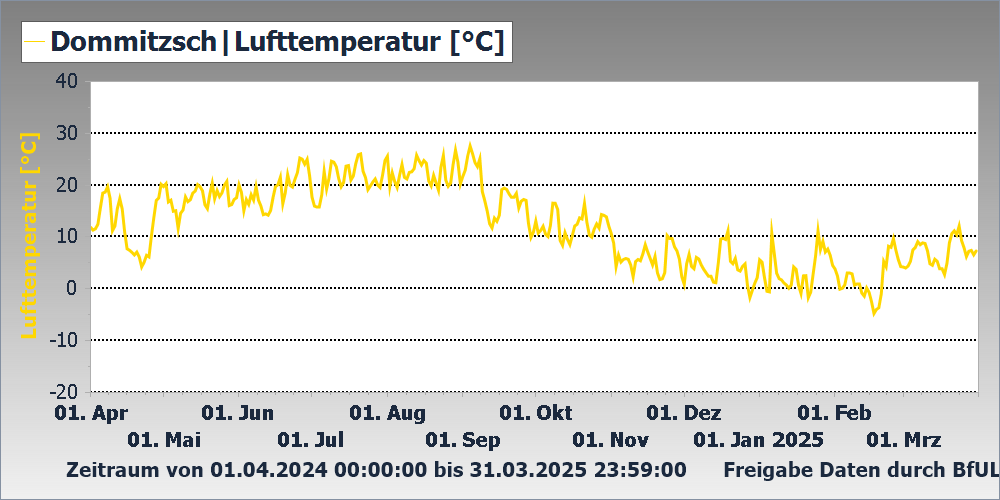
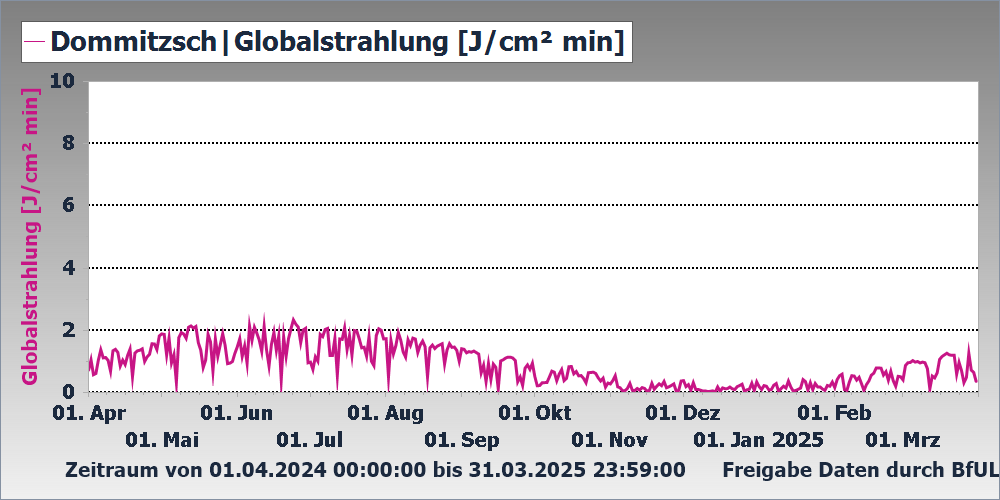
- Grafische Darstellung 2025 (*.pdf, 0,23 MB)
- Messwerttabelle 2025 (*.xlsx, 46,75 KB)
- Grafische Darstellung 2024 (*.pdf, 0,23 MB)
- Messwerttabelle 2024 (*.xlsx, 50,99 KB)
- Grafische Darstellung 2023 (*.pdf, 0,20 MB)
- Messwerttabelle 2023 (*.xlsx, 49,93 KB)
- Grafische Darstellung 2022 (*.pdf, 0,22 MB)
- Messwerttabelle 2022 (*.xlsx, 54,82 KB)
- Grafische Darstellung 2021 (*.pdf, 0,25 MB)
- Messwerttabelle 2021 (*.xlsx, 55,08 KB)
- Grafische Darstellung 2020 (*.pdf, 0,25 MB)
- Messwerttabelle 2020 (*.xlsx, 64,81 KB)
- Grafische Darstellung 2019 (*.pdf, 97,73 KB)
- Messwerttabelle 2019 (*.xlsx, 45,41 KB)
- Grafische Darstellung 2018 (*.pdf, 98,47 KB)
- Messwertabelle 2018 (*.xls, 74,50 KB)
- Grafische Darstellung 2017 (*.pdf, 0,11 MB)
- Messwertabelle 2017 (*.xls, 89,00 KB)
- Grafische Darstellung 2016 (*.pdf, 96,38 KB)
- Messwerttabelle 2016 (*.xlsx, 52,68 KB)
- Grafische Darstellung 2015 (*.pdf, 0,16 MB)
- Messwerttabelle 2015 (*.xlsx, 53,42 KB)
- Grafische Darstellung 2014 (*.pdf, 85,33 KB)
- Messwerttabelle 2014 (*.xls, 84,00 KB)
- Grafische Darstellung 2013 (*.pdf, 83,97 KB)
- Messwerttabelle 2013 (*.xls, 83,00 KB)
- Grafische Darstellung 2012 (*.pdf, 80,52 KB)
- Messwerttabelle 2012 (*.xls, 80,00 KB)
- Grafische Darstellung 2011 (*.pdf, 37,87 KB)
- Messwerttabelle 2011 (*.xls, 0,11 MB)
- Grafische Darstellung 2010 (*.pdf, 38,00 KB)
- Messwerttabelle 2010 (*.xls, 80,50 KB)
- Grafische Darstellung 2009 (*.pdf, 37,71 KB)
- Messwertabelle 2009 (*.xls, 88,00 KB)
- Grafische Darstellung 2008 (*.pdf, 48,74 KB)
- Messwerttabelle 2008 (*.xls, 0,10 MB)
- Grafische Darstellung 2007 (*.pdf, 41,90 KB)
- Messwerttabelle 2007 (*.xls, 0,10 MB)
- Grafische Darstellung 2006 (*.pdf, 42,69 KB)
- Messwerttabelle 2006 (*.xls, 0,11 MB)
- Grafische Darstellung 2005 (*.pdf, 39,56 KB)
- Messwerttabelle 2005 (*.xls, 96,00 KB)
- Grafische Darstellung 2004 (*.pdf, 39,65 KB)
- Messwerttabelle 2004 (*.xls, 67,00 KB)
- Grafische Darstellung 2003 (*.pdf, 39,69 KB)
- Messwerttabelle 2003 (*.xls, 67,00 KB)
- Grafische Darstellung 2002 (*.pdf, 39,35 KB)
- Messwerttabelle 2002 (*.xls, 66,50 KB)
- Grafische Darstellung 2001 (*.pdf, 38,95 KB)
- Messwerttabelle 2001 (*.xls, 67,00 KB)
- Grafische Darstellung 2000 (*.pdf, 38,97 KB)
- Messwerttabelle 2000 (*.xls, 66,50 KB)
- Grafische Darstellung 1999 (*.pdf, 39,63 KB)
- Messwerttabelle 1999 (*.xls, 67,50 KB)
- Grafische Darstellung 1998 (*.pdf, 38,91 KB)
- Messwerttabelle 1998 (*.xls, 67,00 KB)
- Grafische Darstellung 1997 (*.pdf, 38,87 KB)
- Messwerttabelle 1997 (*.xls, 68,50 KB)

