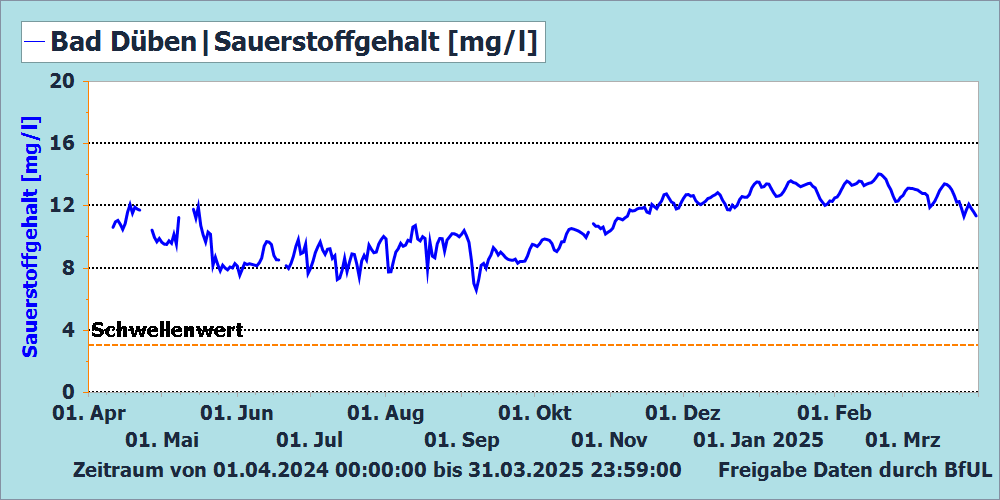
Messstation Bad Düben, Vereinigte Mulde links, Fluss-km: 67
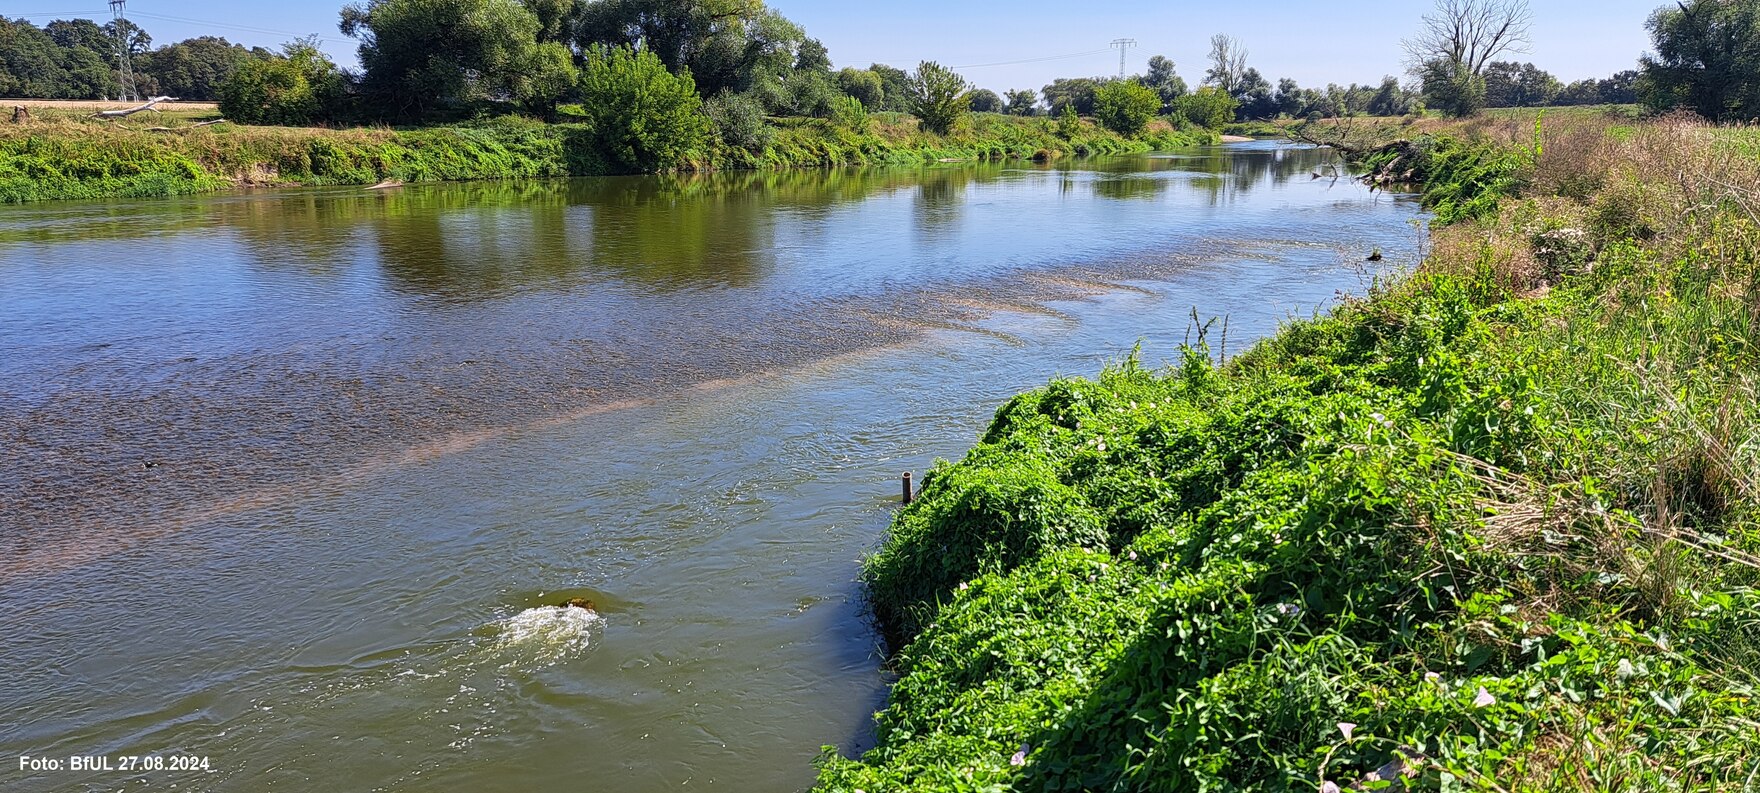

Die Gewässergütemessstation befindet sich flussabwärts von Bad Düben am linken Ufer der Vereinigten Mulde.
Datum der letzten Datenvalidierung:
21.07.2026 05:40 Uhr
Alle Zeitangaben beziehen sich auf die Mitteleuropäische Zeit (MEZ).
Hinweise:
seit dem 12.07.2026 kompletter Stationsausfall durch einen PC-Defekt
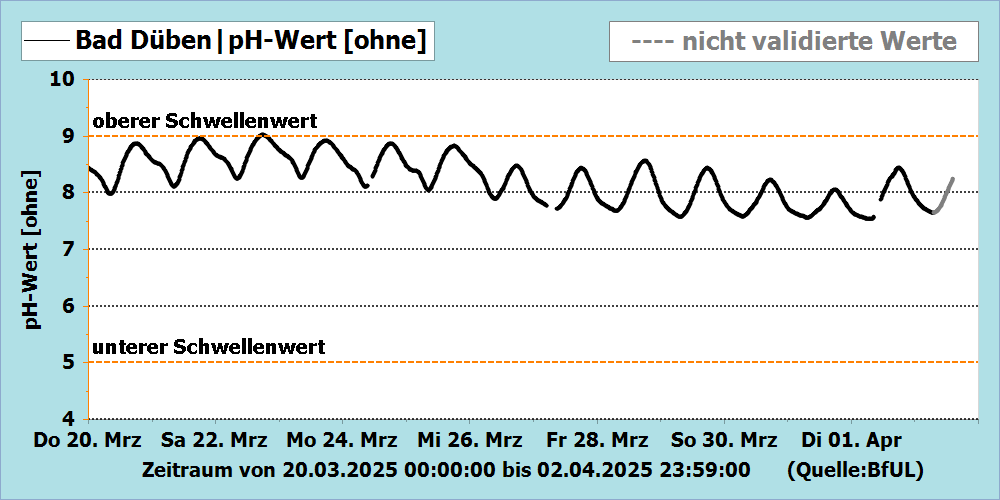
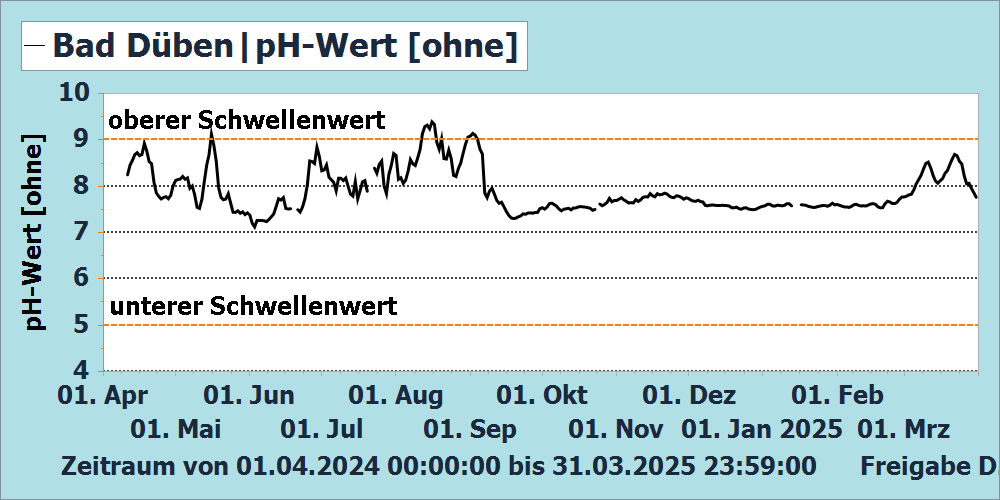
08. - 11.07.2026 saisonal bedingtes Überschreiten des Schwellenwertes bei pH > 9 im Tagesgang
- Messwerttabelle Bad Düben (*.xlsx, 0,2 MB) nur validierte Werte
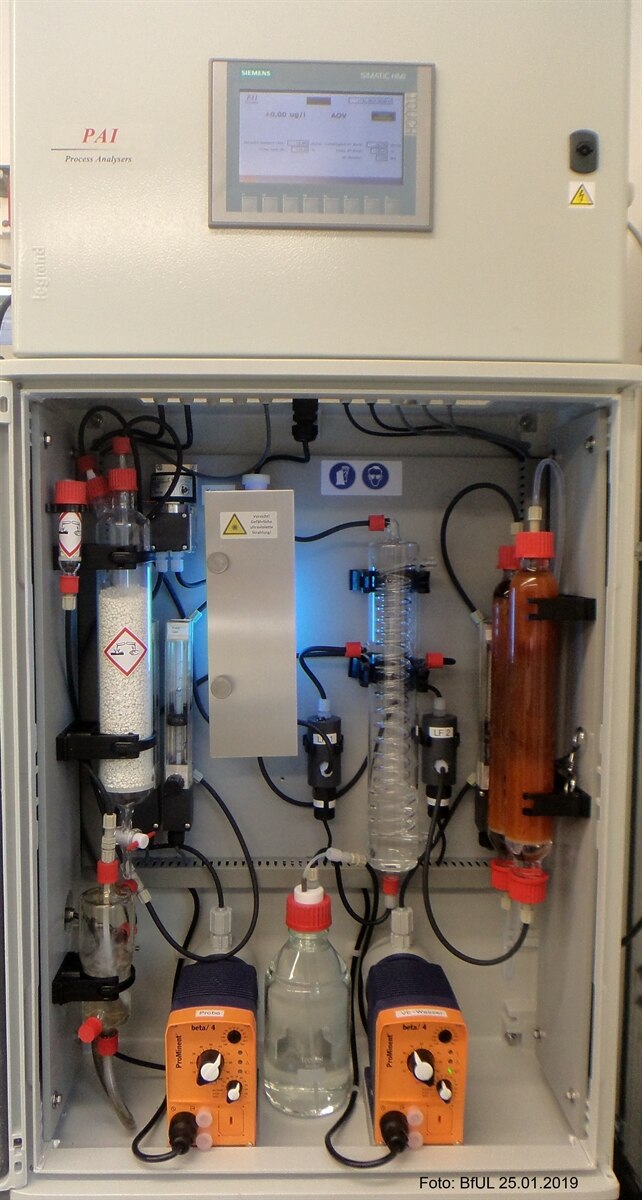
Ausblasbare organische Verbindungen (AOV-Monitor):
![]()
seit dem 12.07.2026 kompletter Stationsausfall durch einen PC-Defekt
Betriebszeit: 1996 - Juni 2018
Juli 2018 - August 2022 Rekonstruktion Entnahmesystem
seit September 2022
Ausstattung:
|
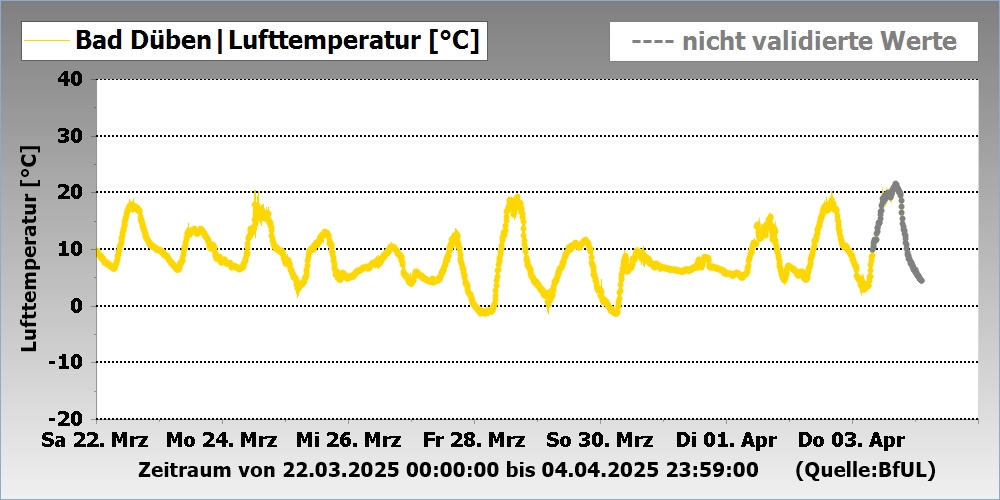
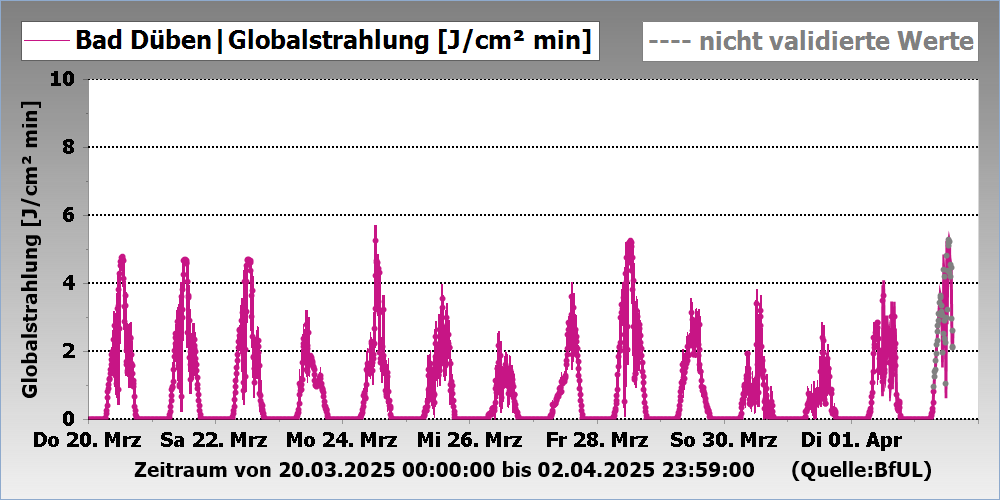
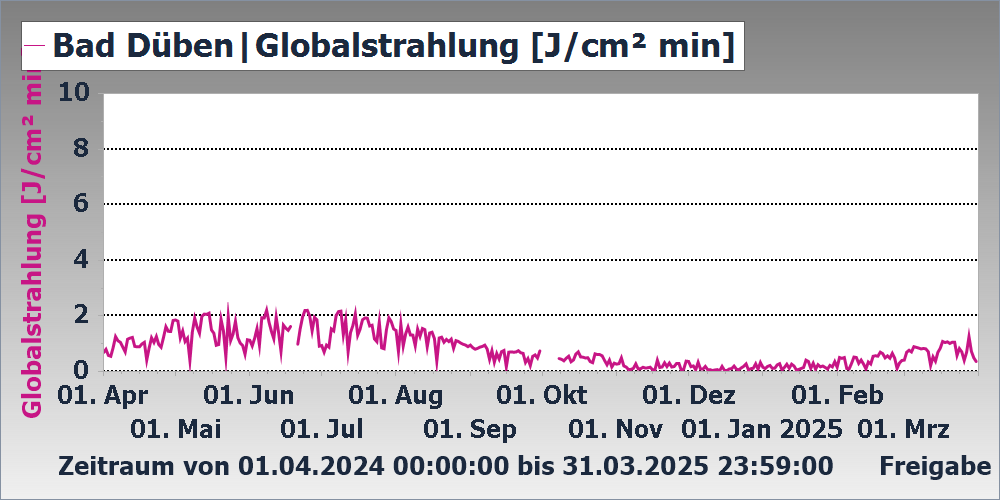
Meteorologische Parameter |
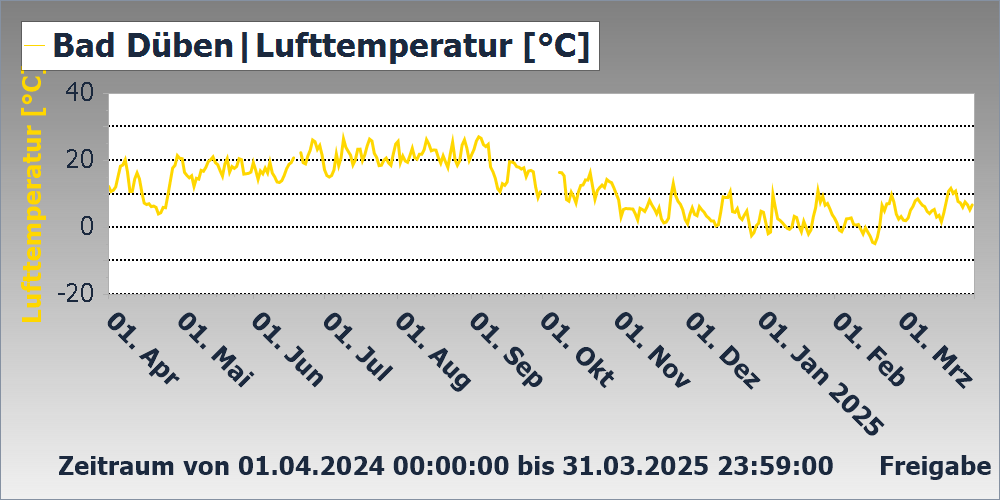
Lufttemperatur |
|
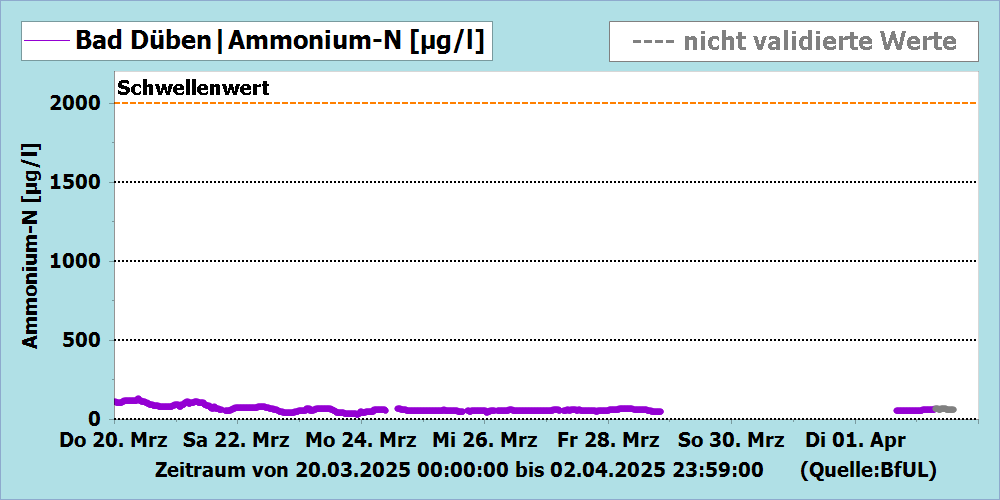
Physikalisch-chemische Parameter |
pH |
|
Probennahme |
3 automatische Probennehmer für Wochenmischproben / Ereignisproben |
|
Betriebsinterne Steuergrößen |
Druckmessung Probenwasser |
|
Datenerfassung |
DFÜ in eine zentrale Datenbank |
Hinweise:
24./25.09.2025 unplausible Messwerte durch Pumpenstörung
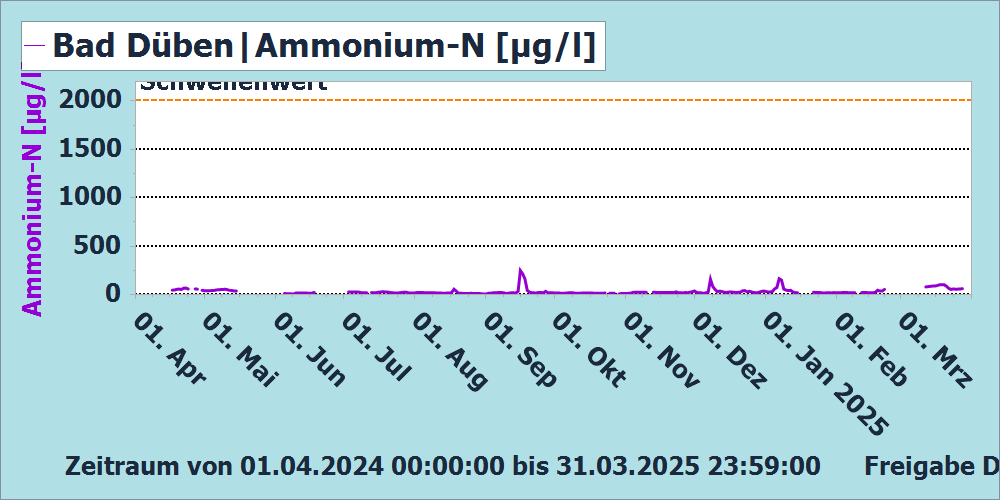
30.10. bis 03.11.2025, 24. bis 26.11.2025, 09. bis 17.12.2025 und 21. bis 31.12.2025 Störung am Ammoniumstickstoff-Monitor
21.12.2025 bis 03.02.2026 Defekt am Ammoniumstickstoff-Monitor
12.01. bis 18.01.2026, 24.02. bis 03.03.2026 und 09./10.03.2026 Stationsausfall durch Störung am Entnahmesystem
30.03. bis 07.04.2026, 27.05. bis 03.06.2026 Defekt am Ammoniumstickstoff-Monitor
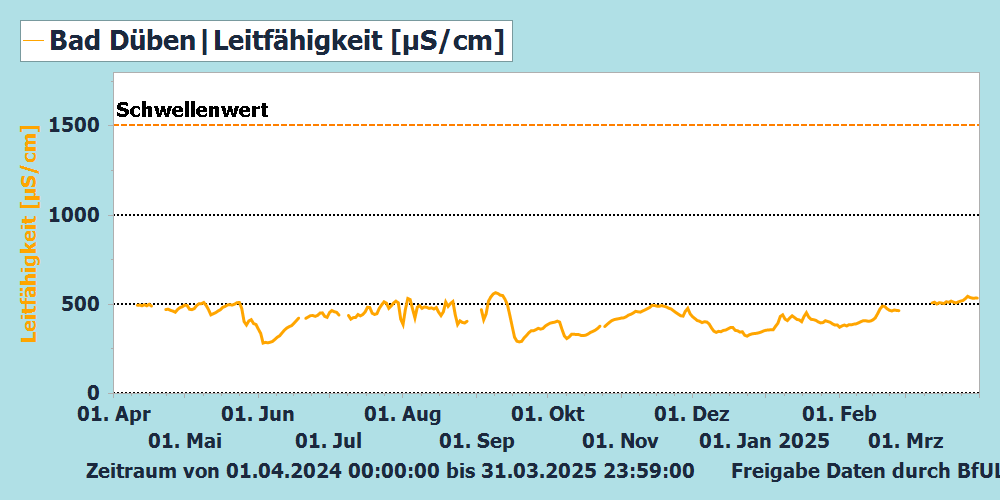
13. bis 16.06.2026 unplausible Leitfähigkeitsmesswerte
19. bis 21.06.2026 und 23. bis 29.06.2026 Stationsstillstand durch Pumpenausfall
Bearbeitungsstand 03.07.2026
Messwertabelle Bad Düben der letzten 365 Tage
- Grafische Darstellung 2025 (*.pdf, 0,24 MB)
- Messwerttabelle 2025 (*.xlsx, 52,76 KB)
- Grafische Darstellung 2024 (*.pdf, 0,22 MB)
- Messwerttabelle 2024 (*.xlsx, 46,12 KB)
- Grafische Darstellung 2023 (*.pdf, 0,21 MB)
- Messwertabelle 2023 (*.xlsx, 56,96 KB)
- Grafische Darstellung 2022 (*.pdf, 0,19 MB)
- Messwerttabelle 2022 (*.xlsx, 38,53 KB)
- Grafische Darstellung 2018 (*.pdf, 92,01 KB)
- Messwertabelle 2018 (*.xls, 58,00 KB)
- Grafische Darstellung 2017 (*.pdf, 0,10 MB)
- Messwertabelle 2017 (*.xls, 85,00 KB)
- Grafische Darstellung 2016 (*.pdf, 0,11 MB)
- Messwerttabelle 2016 (*.xlsx, 51,28 KB)
- Grafische Darstellung 2015 (*.pdf, 0,16 MB)
- Messwerttabelle 2015 (*.xlsx, 51,91 KB)
- Grafische Darstellung 2014 (*.pdf, 87,01 KB)
- Messwerttabelle 2014 (*.xls, 84,00 KB)
- Grafische Darstellung 2013 (*.pdf, 84,81 KB)
- Messwerttabelle 2013 (*.xls, 82,50 KB)
- Grafische Darstellung 2012 (*.pdf, 83,99 KB)
- Messwerttabelle 2012 (*.xls, 82,50 KB)
- Grafische Darstellung 2011 (*.pdf, 38,02 KB)
- Messwerttabelle 2011 (*.xls, 0,11 MB)
- Grafische Darstellung 2010 (*.pdf, 38,05 KB)
- Messwerttabelle 2010 (*.xls, 80,50 KB)
- Grafische Darstellung 2009 (*.pdf, 38,13 KB)
- Messwerttabelle 2009 (*.xls, 88,00 KB)
- Grafische Darstellung 2008 (*.pdf, 49,75 KB)
- Messwerttabelle 2008 (*.xls, 0,10 MB)
- Grafische Darstellung 2007 (*.pdf, 42,88 KB)
- Messwerttabelle 2007 (*.xls, 0,10 MB)
- Grafische Darstellung 2006 (*.pdf, 43,34 KB)
- Messwerttabelle 2006 (*.xls, 0,10 MB)
- Grafische Darstellung 2005 (*.pdf, 39,48 KB)
- Messwerttabelle 2005 (*.xls, 95,50 KB)
- Grafische Darstellung 2004 (*.pdf, 40,06 KB)
- Messwerttabelle 2004 (*.xls, 71,50 KB)
- Grafische Darstellung 2003 (*.pdf, 40,12 KB)
- Messwerttabelle 2003 (*.xls, 66,00 KB)
- Grafische Darstellung 2002 (*.pdf, 39,52 KB)
- Messwerttabelle 2002 (*.xls, 64,50 KB)
- Grafische Darstellung 2001 (*.pdf, 39,45 KB)
- Messwerttabelle 2001 (*.xls, 66,50 KB)
- Grafische Darstellung 2000 (*.pdf, 39,29 KB)
- Messwerttabelle 2000 (*.xls, 66,50 KB)
- Grafische Darstellung 1999 (*.pdf, 39,00 KB)
- Messwerttabelle 1999 (*.xls, 66,50 KB)
- Grafische Darstellung 1998 (*.pdf, 39,52 KB)
- Messwerttabelle 1998 (*.xls, 66,50 KB)
- Grafische Darstellung 1997 (*.pdf, 39,20 KB)
- Messwerttabelle 1997 (*.xls, 68,00 KB)
- Grafische Darstellung 1996 (*.pdf, 39,25 KB)
- Messwerttabelle 1996 (*.xls, 63,00 KB)